Bullish Engulfing Pattern
More Chart Patterns
Bullish engulfing pattern is one of the most popular candlestick patterns among the variety of financial technical analysis tools available to assess the performance of your stocks.
If you are keen on exploring stock performance, then you may have already studied the high, low, open and close data points of candlestick patterns for the synthesis of multiple time frames. In case you haven’t, here’s a quick graphical representation of the basic candlestick pattern.

Figure 1: Candlestick Pattern Basics
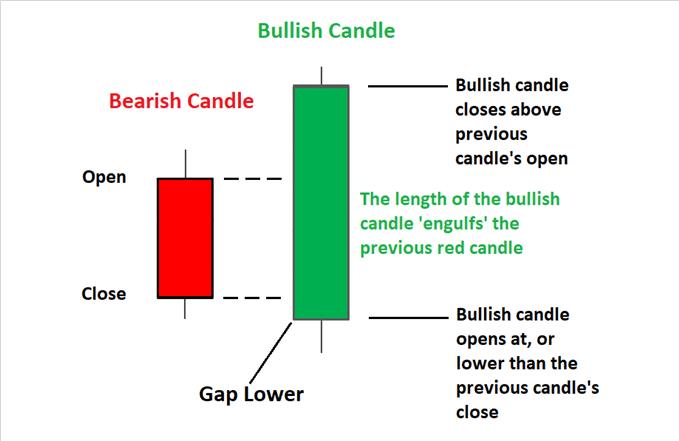
That said, let’s now iterate the importance of the context of interpreting candlesticks. In the bullish engulfing pattern, you are likely to see a green candle engulfing the red candle that precedes it. The red candle of the preceding day represents selling in limited volumes.
In this case, the dominating bearish trend is overcome by the bullish pattern on the next day, giving way to a strong buying force.
Bullish Engulfing Pattern Definition
Bullish engulfing is helpful when you are looking for stock reversals. It depicts a sign of stocks moving up, after a period of sluggish bearish runs.
The red bar accompanies a negative stock market sentiment, and the engulfing green bar of the bulls pulls the stocks up higher with many more buyers stepping in.
In short, the large bullish candle engulfing the preceding low-lying bearish pattern is an attempt to provide thrust for growth even when the stock market is at its rock-bottom.
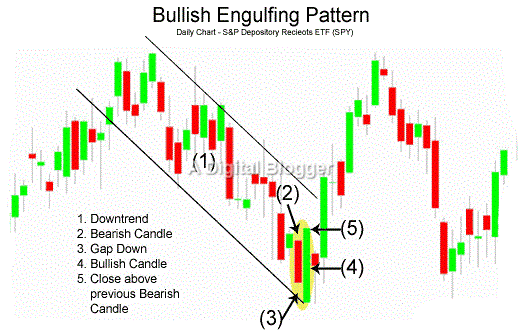
The following figure shows a hypothetical example of a bullish trend.

Figure 2: Bullish Engulfing Pattern
Bullish engulfing means a lot to the strategic stock market trader.
You may combine several statistical tools with the Bullish engulfing pattern to find a viable conclusion for trading your stocks with success. Some of these tools are stochastics, moving average convergence divergence (MACD), and Bollinger bands.
Stochastics help to improve the accuracy of your trading decisions when a bullish trend comes up.
MACD is very helpful to determine trading decisions when a bullish trend emerges as it helps understand the crossover of moving averages and the reliability and strength of stock signals.
Bollinger pattern helps to discern the volatility and trend inherent in stocks.
Bullish engulfing patterns are interpreted in different ways by stock market traders.
While some traders believe that the tails of candlesticks must be included in the analysis of stock decisions, others think that a bullish engulfing pattern is valid even when the tails are not engulfed.
Whatever the interpretation of the case in point may be, more market traders are inclined towards buying as opposed to selling a specific stock instrument when this situation arises.
Another important aspect you may find useful while interpreting bullish engulfing patterns is that it is possible for more than a single candle to engulf the preceding red candle in this arrangement.
This means that a single red candle may be followed by two, three, or even four green candlesticks of varying length, all forming a part of the bullish candlestick pattern.
This combination of candlesticks is still considered to engulf the single preceding red candlestick as long as the body (and tails) is fully covered by its green counterparts.
The bullish engulfing pattern presents useful signals for stock traders. A stock trading professional may choose to buy stocks immediately, or at the end of the second day, which is right after the reversal of market sentiment.
Alternatively, the trader may choose to wait for another day to confirm that the sentiment persists.
Bullish patterns may be used by conservative stock traders as well who prefer to wait until the next signal which is a convincing reason to proceed with a buy order.
Bullish Engulfing Pattern Rules
There are a few basic rules that you need to take care of while setting a profitable trade in a bullish engulfing pattern:
- Before you enter the trade, the prior trend must be a downtrend.
- The first session of the pattern must be a red candle, thereby, validating that the market is still in a bearish mode.
- In the second session, the market must be bullish enough to eat up the bearish trend set up in the last trading session.
Although, you may get a bit distracted in order to make some quick profits.
However, you must strictly adhere to the rules mentioned above to stay profitable in the trade.
Bullish Engulfing Pattern Example
Let’s take a quick example to understand how Bullish Engulfing Pattern can be identified and then made use of in your trades.
Look at the chart below:
Let’s say, the stock price of ABC Tech had the following OHLC on 16th September:
- Open: 289
- High: 299
- Low: 281
- Close: 285
This trend shows that the sellers were in charge and the stock was going through a bearish pattern.
Then, on 17th September, the ABC Tech stock opened at 284 and suddenly bulls started fancying around taking the stock high for the day to 305 and closed the day at 302.
What happened there suddenly?
Although on the first day, it looked at the stock is going down the barrel but for some reason, the next day, the stock trend looked to have to correlation whatsoever on what had happened the previous day.
This trend reversal is called Bullish engulfing where the second session more or less eats the previous day price trend in a bullish way.
If you are a risk-taker, you may still continue to be bullish on this stock and then exiting after making a quick profit. That makes sense but mostly, this trend gives you a hint that this particular stock can behave in this manner in any upcoming session as well.
Thus, it makes total sense to be bullish at the right time.
Bullish Engulfing Patterns Reliability
The bullish engulfing pattern could prove challenging for decision-making during stock trading as the pattern may look different on two dissimilar timeframes.
This means that a stock trader may have difficulty attributing a certain level of confidence to trading decisions executed on the basis of this pattern.
Traders may sometimes find it more meaningful to evaluate a group of candlesticks as opposed to a single instance and implement their final decisions accordingly.

Risk management for stock traders may be particularly challenging when using the bullish candlestick patterns. As mentioned above, this risk may be overcome when the pattern is interpreted against benchmarks in statistical analysis tools.
In other words, it may be risky to subjectively assess the validity of signals in a bullish trading pattern on the basis of graphical candlestick charts alone.
However, when the behaviour of these patterns is combined with statistical analysis tools, stock traders are at an advantage of proactive decision-making for achieving success with their trading strategy.
The most successful stock trading decisions are based on observing the right signs when a flip over happens as a bullish engulfing pattern starts to unfold.
Traders are advised to be especially careful when interpreting bullish engulfing patterns when significant size differences occur in the candlesticks for the first and second day.
Specific instances that hold importance for stock traders include occurrences of high volume, major downtrends or up trends, or when the real body of the candle for the first and second day engulfs the shadows and body of the first day.
Bullish Engulfing Pattern Confirmation
The bullish engulfing pattern confirmation can be seen only in the third trading session when the bullish trend continues and takes the stock price to the levels above the second day.
Thus, in a chart when you are performing your analysis, you must be eyeing the 3rd candle in the pattern. If it continues the positive trend, this is a direct confirmation for you that the pattern here is a bullish engulfing one.
You may choose to go bullish momentarily on this trend before making a quick profit and then subtly exiting the trade!
Sleek, right?
Bullish Engulfing Pattern Summary
In effect, the bullish engulfing pattern is an important indicator of reversal of the dynamics of stock markets. Irrespective of your stock trading style, it presents viable evidence for your stock trading decisions.
Both liberal and conservative traders may combine bullish patterns with statistical analysis to accurately make sense of complete reversal in investor sentiments.
Observing specific signs with respect to trends increases the significance of the bullish engulfing trading pattern.
The pattern is significant to stock analysts who study the viability of a buy decision in light of its increasing momentum and robustness.
Stock analysts must combine technical tools with past experience to arrive at a buy decision after detecting a sentiment reversal triggered by a bullish engulfing pattern.
In this way, bullish engulfing patterns can be employed in the form of essential clues for successful stock trading.
In case you are thinking of getting started with stock market investments or trading, let us assist you in taking the next steps forward:
More on Share Market Education
In case you are looking to learn more about Chart Patterns, here are some reference articles for you:


