


Looking for Low Brokerage, High Margin & Free Tips?
How to Analyze Option Chain?
| | Option Trading | No Comments
You know what differentiate options trading from equity, you cannot just take a trade position simply by looking at technical charts. One has to do option chain analysis as well. But how to analyze the option chain?
Yes, as a beginner this is the most challenging part in options.
But there are ways to simplify it as well and one such way is to understand the right meaning of option chain and filtering the data to make it easier to read.
Wondering how?
Let’s get you covered and understand all the data of the option chain in detail.
What is Option Chain Analysis?
Okay, so before covering how to analyze an option chain, let’s have a quick understanding of what the option chain is.
Option chain is the chart that represents all the information of the underlying asset whose contract you want to trade in the market.
For example, Nifty 50 option chains display all the data like spot price, strike prices, expiry, and other advance data that helps a trader in gaining in-depth analysis of options.
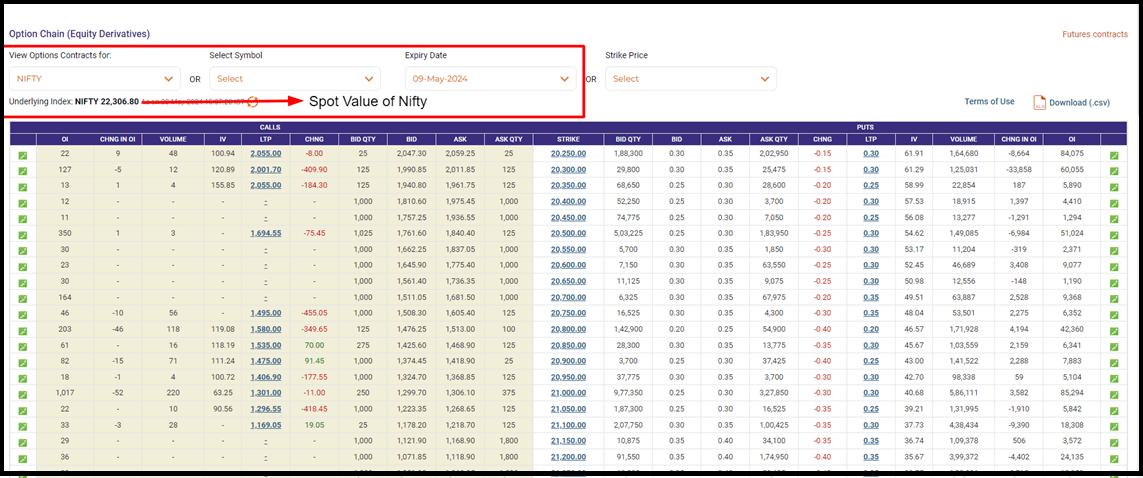
This is how it looks.
Yes, it seems to be confusing at the first glance, but you can simplify it by understanding the meaning of each and every parameter displayed in the chain.
To get started let’s first understand the meaning of the underlying asset.
What is the Underlying Asset in Options?
To understand this, let’s revise option trading basics.
Options is the contract that gives the buyer a right but not obligation to trade underlying assets on expiry and to gain this right, option buyer pays premium to option seller.
Here the underlying asset means the stock or index the value of which impacts the value of your premium.
Let’s understand this with an example:
Suppose due to flooding, the wheat price shoots up.
Now the price of which commodity will be impacted by this?
Ofcourse, flour prices.
Here flour price is the premium the value of which depends upon the wheat which is an underlying asset.
Similarly if you are trading in Nifty, the value of Nifty will impact the call and put option premium. So, if the market is bullish, the call premium will increase and in the bearish market put option surges.
In the NSE option chain the details of the underlying asset is on the top left.
Here you can choose to trade in index or stock options and get the detailed option chain on selection.
What does Option Expiry Mean?
Next comes the data of expiry.
As you all are aware that options come with the validity and it is on the expiry day that option buyer choose either to exercise the contract or close the position with the loss of premium.
Choosing expiry is vital as it helps in determining the capital required to trade and further in evaluating risk-reward ratio.
Now, there are two types of expiries, weekly and monthly expiry.
Indexes like Nifty, Bank Nifty, Bankex etc have both weekly and monthly expiries while stock options only have monthly expiry.
Here is the detail of expiry of different assets traded in options.
| Index Expiries | Change in OI With Respect to Premium | Change in OI With Respect to Premium |
| Index | Weekly Expiry | Monthly Expiry |
| Nifty 50 | Thursday | Thursday |
| Bank Nifty | Wednesday | Wednesday |
| Finnifty | Tuesday | Tuesday |
| Nifty Midcap | Monday | Monday |
| Sensex | Friday | Friday |
| Stocks | - | Thursday |
Strike Price in Option Chain
Next important data in the option chain is the strike price. In the option chain the details of strike price is displayed in the centre row.
But what does it mean?
Simply, it means the value at which the buyer wants to settle the trade on expiry or the seller wants to earn a premium by selling the contract with the respective value.
For example if the current value of Infosys is ₹1500 and you bought INFY 1450 CE, this means that you are bullish in the stock and want to settle the trade on expiry by buying Infosys stocks at ₹1450 if the price goes up.
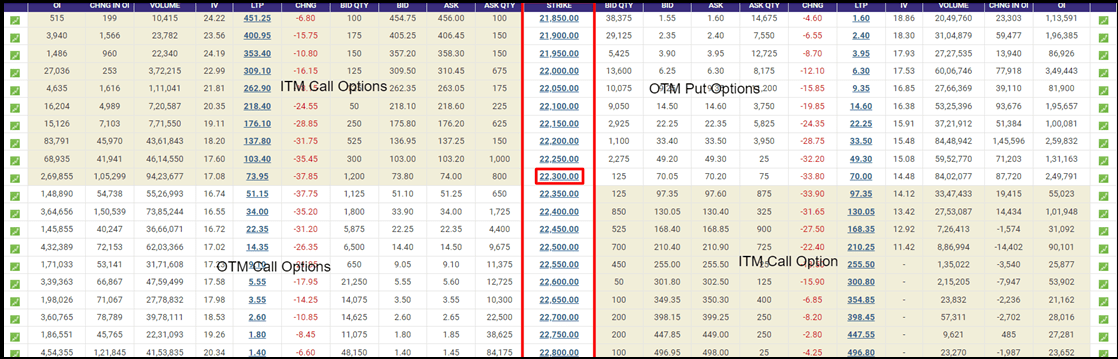
Now on the basis of the current value of the underlying asset, also known as spot price, there are different types of strike prices which are commonly known by names, ITM, ATM and OTM options.
Let’s understand this with the help of an example:
Consider the above example, where you bought Infosys call option at 1450 CE strike price when the stock was trading at ₹1500 in the equity market.
Now, let’s say that it is the expiry day (the day to settle the contract), this means the options expire above the strike price thus giving you the opportunity to trade and earn a profit of ₹50.
This ₹50 is also known as intrinsic value which is calculated as:
Intrinsic Value for Call Option = Spot Price – Strike Price
Intrinsic Value for Put Option = Strike Price – Spot Price.
Also, this value is always positive, so a negative value is rounded off to zero.
Now coming back to the concept.
Any strike price with the positive intrinsic value is called In the Money (ITM) Strike Price, while the one with negative or zero intrinsic value are Out of the Money or OTM options.
So, if the option expires out of the money this means the buyer loses the premium.
And the strike price which is near to spot price is called At the Money or Near the Money Options. The intrinsic value of ATM options is almost equal to zero.
Now, there are many parameters that help you in deciding which strike to trade in which we will discuss ahead.
LTP in Option Chain
Next is LTP, i.e. Last Traded Price which tells you the current premium value of any strike price.
Along with LTP there is one more column displaying data of LTP change, this tells the value by which the premium value increased or decreased on a particular day and eventually helps you in determining market behaviour without looking at the charts.
For example, if LTP change at the call side for ATM option increases while it decreases on put side, this indicates the uptrend in the market.
However, if LTP change is same on both sides then it signals the sideways market trend.
OI in Option Chain
Another important parameter that helps you in determining market behaviour is Open Interest or OI in the option chain.
It tells about the number of open contracts in the market.
Here unlike volume, where traders get an information of the number of total contracts bought and sold, open interest only tells about the number of contracts and not traders in the market.
The strike price with the highest OI gives data of the interest of the option seller towards a corresponding strike price.
For example, OI of NIFTY 22000 CE is 1,00,000 and that of NIFTY 22000 PE is 80,000 this indicates strong interest of option sellers on the call side.
Since option sellers are bearish hence one can predict Nifty movement and market trend by looking at this data.
Along with this it is important to note that OI alone does not give much information and one has to look for change in OI with respect to change in LTP.
Here is how to do analysis of options by looking at OI data.
| Change in OI With Respect to Premium | Change in OI With Respect to Premium | Change in OI With Respect to Premium |
| Price (Premium Value) | Open Interest | Underlying Outlook |
| Increasing | Increasing | Long Buildup |
| Decreasing | Decreasing | Long Unwinding |
| Decreasing | Increasing | Short Buildup |
| Increasing | Decreasing | Short Covering |
One must take a position on the strike price for which OI is increasing as it directly tells about the interest of other traders towards that value.
IV in Option Chain
Next comes the IV or Implied Volatility that tells and helps in predicting the future volatility of underlying assets in options.
For example, if Nifty current value is 22,000 and the IV for ATM option is 12% this means that Nifty could trade in the range of 19,350 to 24,650 in the next one year.
Now this IV is generally impacted or say is increased when there is any event, announcement, quarterly results etc.
The increase in IV increases the risk of option sellers which eventually leads to higher premium value.
Option buyers, thus, avoid trading in the market when IV is high, however can take a risk of opening a new position when there is any kind of announcement or event scheduled for upcoming days.
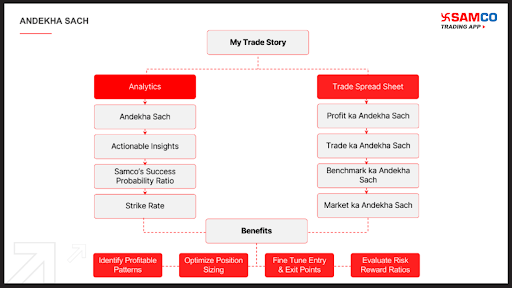
You can reduce this risk by analysing the data properly and further with the help of one of the features of the Samco Trading platform, ‘My Trade Story’.
This feature in this app for option trading records your trading records and tells you about the Andekha Sach of your trades.
With this feature you can know total profitable and loss making trades done in a particular period and get the data of probability success ratio that makes it simpler for you to determine your level of trade.
Not only this, on the basis of the score it provides the ways that help in improving your trade results as well.
Now apart from these there are some other data points in the option chain as well, like:
Volume : It tells the total number of option contracts bought and sold at a particular time.
Bid Price : The premium that buyers are willing to pay for a particular strike price.
Ask Price : The premium the sellers want to get for a particular strike price.
Advanced Option Chain Analysis
Above data points are enough to understand the options, but to get into the detail of option trading risk and reward associated with trading options one must consider analysing option Greeks and their impact of premium value.
Option Greeks in Option Chain
Let’s understand the meaning of option greeks first.
It is the financial metric that helps in analysing the change in premium value with respect to different parameters discussed above, like expiry, IV, intrinsic value etc.
They are four option greeks:
- Delta
- Gamma
- Theta
- Vega
This Greeks data is available in advanced options chains available on different platform. Let’s cover each of these greeks in detail.
1. Delta in Option Chain
So, in the above section, it was mentioned that there are three different types of strike price, ITM, ATM and OTM.
ITM are expensive or have higher premium value in comparison to OTM and ATM.
The reason is the intrinsic value in those options. More the difference between spot price and strike price more will be the intrinsic value and hence premium.
Now let’s say, Nifty 22000 CE is the ATM option with a premium of ₹50. Let’s say the market is strongly bullish and soon Nifty increased by 100 points.
In this case, Nifty 22100 CE would be a new ATM thus making Nifty 22000 CE ITM option.
So, as per the rule ITM options must have higher premium than ATM and hence the value of Nifty 22000 CE would increase.
But the question is, by how much?
This change in option premium is calculated using Delta.
It tells the change in premium with every ₹1 change in underlying asset. It’s value is in the range of 0-1 for Call Options and -1 to 0 to Put Options.
Again the value for ITM, ATM and OTM options are;
| Delta Value in Options | ||
| Strike Price | Delta for Call Option | Delta for Put Option |
| ITM | 0.6 - 1 | -0.6 - (-1) |
| ATM | 0.5 | -0.5 |
| OTM | 0-0.6 | 0 - (-0.6) |
The negative sign in put option delta is used to represent the bearish sentiment of option buyer.
Let’s do a simple calculation to understand the concept of delta.
In the example above, the premium for ATM strike price is ₹50. Later the market increased by 100 points.
Since ATM delta is 0.5 hence the change in premium would be:
0.5*100
= ₹50
Hence new premium value would be :
50 + 50
=₹100
However, if the market falls down by 100 points then there would be a loss of ₹50.
In this way you can determine the target and stop loss for your trade position.
2. Gamma in Option Chain
Gamma is the second order greeks means it helps in determining the change in delta value with the change in the value of underlying asset.
For example, ATM option has 0.5 delta but as soon as ATM option becomes ITM, the delta value increases and falls in the range of 0.6-1.
Gamma calculates the degree or by how much this delta will change with respect to underlying asset value.
It is always positive and is highest for ATM options and decreases for both ITM and OTM strike prices.
3. Theta in Option Chain
Another Option Greek tells about the most important data point, i.e impact of time value on options.
You might be aware that option premium loses its value as it approaches expiry.
This means the premium of option decreases with each passing day and to calculate the rate at which the value decreases is calculated with the help of theta.
It is always negative as it always indicates declining value of options and is the highest for ATM options, making it the most risky option to trade.
Now, let’s say that Theta for a particular strike price is -10, this means that with each passing day the value of that option will decrease by 10.
Also, the theta for the option with near expiry is the highest. Therefore, if you want to hold an option for overnight, it is recommended to trade far expiry option contracts.
4. Vega in Option Chain
Last important Option Greek is Vega, that calculates the impact of Implied Volatility in Options.
As discussed above, any kind of event or announcement increases implied volatility making options expensive.
Now, for each % change in IV the change in premium is determined using Vega.
So, for example, Vega is 10 this means for every 1% change in IV premium will change (increases or decreases by ₹10.
If IV increases, premium will increase and vice versa.
Conclusion
Option chain looks complex but by understanding the meaning of each data point one can simplify the understanding of option chain analysis.
Use the above data points in your next analysis and in framing options trading strategies for indian market and start analysing options without charts.